
How to make profits in cryptocurrency trading with machine learning

The interest around cryptocurrency technology grows day after day, and the research about Machine learning has never been so fast.
Could a machine trained to trade cryptocurrency make profits ? At Smile Innovation we gave it a try! 😃
If you think we have grown neurons in a laboratory, it is not far from the reality. Just kidding 😉(but take a look at “What is an Artificial Neuron?” to know the truth). As lucky as you are, let’s discover an amazing new world.
We assume that anyone reading this article doesn’t know a lot about machine learning and cryptocurrency. But don’t worry, everybody can understand. All concepts are simplified and you can find pictures and gifs to help you to figure out what we are talking about.
Let’s introduce what cryptocurrency is, and if you’re still with us at that time, we’ll introduce machine learning.
*“A cryptocurrency (or crypto currency) is digital asset designed to work as a medium of exchange that uses strong cryptography to secure financial transactions, control the creation of additional units, and verify the transfer of assets. […]Cryptocurrencies use decentralized control as opposed to centralized electronic money and central banking systems.” , Wikipedia Cryptocurrency*
*“Machine learning is the idea that there are generic algorithms that can tell you something interesting about a set of data without you having to write any custom code specific to the problem. Instead of writing code, you feed data to the generic algorithm and it builds its own logic based on the data.” Wikipedia Machine learning*
We will probably use the term “Neural network” to speak about machine learning, you only need to understand that a “neural network” is a kind of a machine learning technique and “Long Short Time Memory(LSTM)” is a type of neural network (cf “LSTM” ).
LSTM
LSTM for “Long Short Time Memory” is a model design that processes past data to give a prediction. It’s a type of neural network.
Let’s illustrate this with an example.
If I tell you “give me the next number after 6”, what can you say ? Naturally you will give “7” because it is the next one, but why not “8” if the series is “N+2” ?
Ok, now I tell you “give the next number after 3, 6,… “ and now you can answer with “9” or “12”, because the link between 3 and 6 can be “N+3” or “N*2”. Then I tell you “give me the next number after 0,3,6” and you see that the answer is “N +3”.
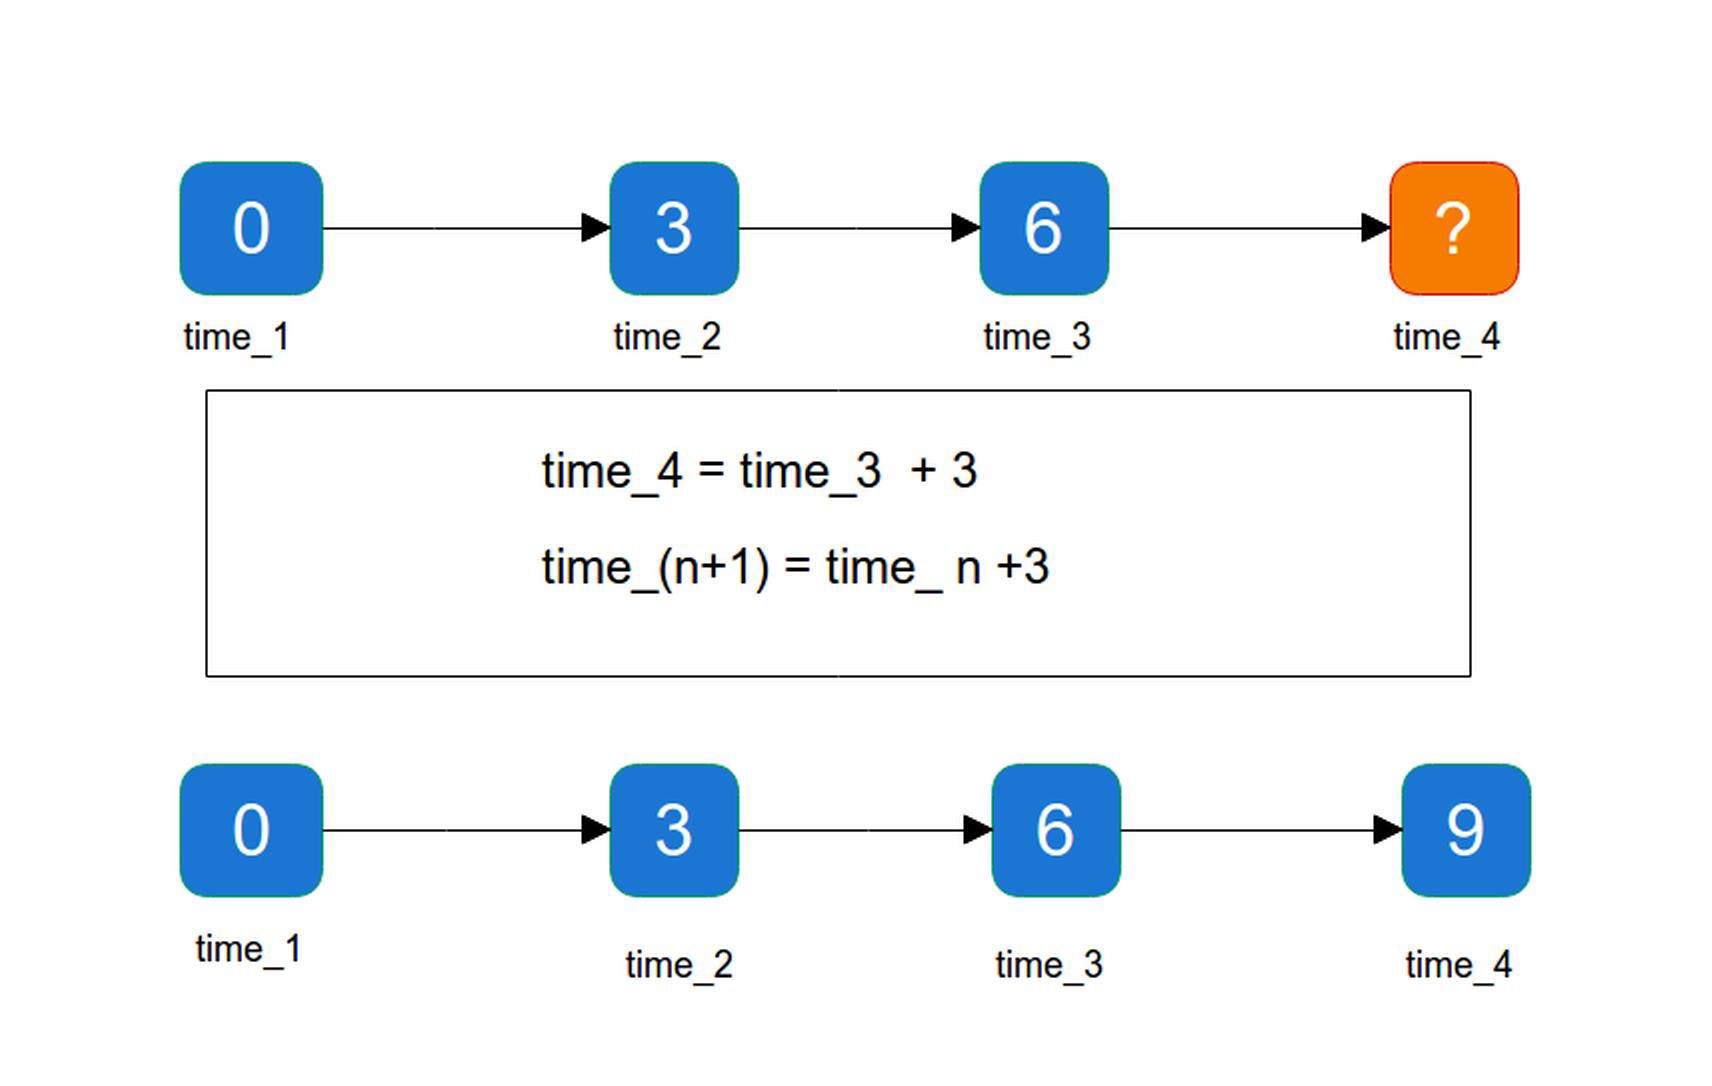
Here, you implemented, in your brain, a simple series check. You used the past values to predict the next one. However, you need enough values in the example range to be able to predict the right result, or at least the most probable one.
Your brain is able to make that for a large variety of “data”. For example, when you look at a ball thrown in the air, you can predict where it will fall, because your brain analyses the position at different steps, and can predict the next steps until the final position.
With LSTM, it is a bit more complicated but the basics are the same: we send a “chronological series” to let the neural network find the next probable value. A huge dataset, build on a long period, is not needed. You need enough data, to split the dataset in small chronological chunks, for the neural network to be able to understand and predict the next value.
Different trading algorithms types:
There are 2 types of trading algorithms characterized by different speeds, turnover rates, and order-to-trade ratios that leverages different frequency financial data and electronic trading tools. While there is no single definition of High-frequency trading and Low-frequency trading, among their keys attributes are very short-term(HFT) investment horizons or longer(LFT).
High-frequency trading(HFT): It takes between 300 to 400 milliseconds for the human eye to blink. During this time a common “HFT” has passed around 400 orders, why is it so fast ? because it only communicates with one and only one server and this is the point, it is not possible to do “HFT” algorithm on cryptocurrency because the technology is decentralized. This kind of trading needs big infrastructures (super calculators, extremely fast connection, not everybody can have it).
**Low-frequency trading (LFT): **Considering this high hardware requirement for HFT, we rather focused on low-frequency trading. Furthermore it has already happened HFT program disturbed the market (example link).
We chose the cryptocurrency market because data is easy to get (API, Kaggle datasets, etc…) and it is a decentralized asset.
What about Data ?
We used a software to get the data from “Bittrex” — an exchange platform of cryptocurrency — then save it to a database. (Crawler Bittrex)
Our sample of data once collected has this format:
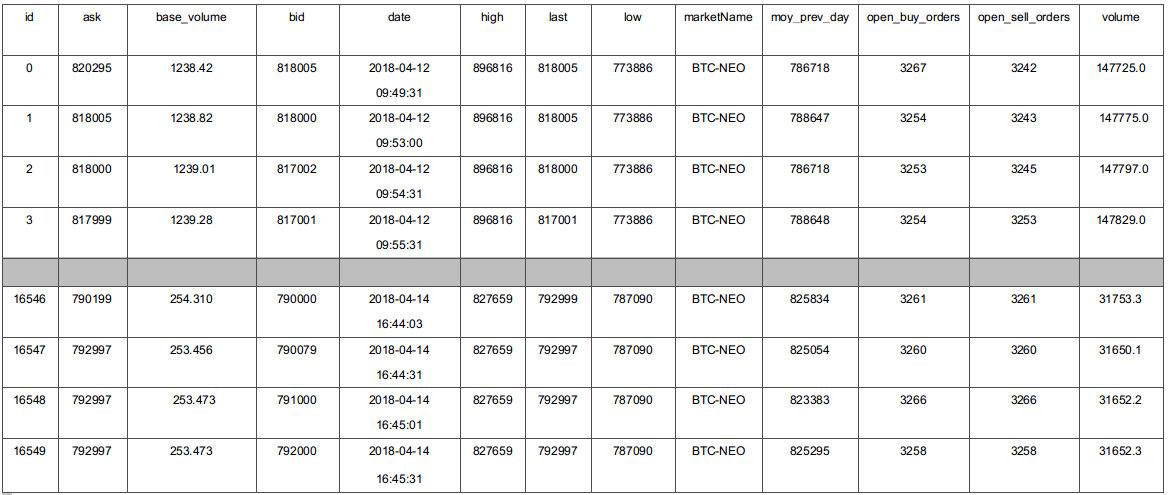
In finance, we call these rows “tickers”, a “ticker” is a snapshot of all market variables at time t.
Cryptocurrency market is an asset pair like BTC and NEO. Compared to financial market it can be EUR an USD.
Data processing
First, we reduced the number of the columns (features) because it is obvious that some features are more relevant than others. To decide which one, we compute the part of the variance of each feature, and we take features with the best variance part. We know in financial data that the values are not linear, therefore it is not easy to find a link between x and y such that f(x) = y. **In other words we cannot teach to our LSTM how it can make an action y** according to its parameter x. To deal with this problem we transform our data, we used here a logarithmic function.
Logarithm transformations convert multiplicative or ratio relationships to additive which is believed to simplify and improve network training. Logarithmic transformation is useful for data which can take on both small and large values.

This transformation helps our neural network find a persistent link between the features x firstly and secondly a persistent link between the features x and an action y chosen.
After that, the data is standardized to reduce the variation around the mean due to the volatility of financial data. The standardization of each value is computed as the following formula :
new Xi = (old Xi — mean(X)) / standard-deviation(X)
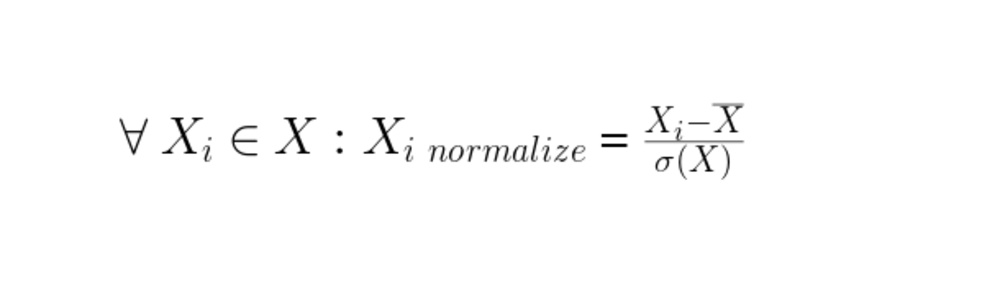
The standard deviation computes the gap between the value and his mean.
Labeling
Data labeling determines what you want to teach to your neural network, and also how you want it learned.
The first question that comes to our mind is what did we need to teach our AI ? Price prediction ? Crash prediction? Top or bottom prediction ? Human-like professional trading?
All the previous methods work but in our case we chose the top and bottom prediction because it can be applied on all market types with different time intervals. Furthermore we have never found any professional trader in our workspace and none of them would ever sit with us to help us teach an AI to do better than him 😄.
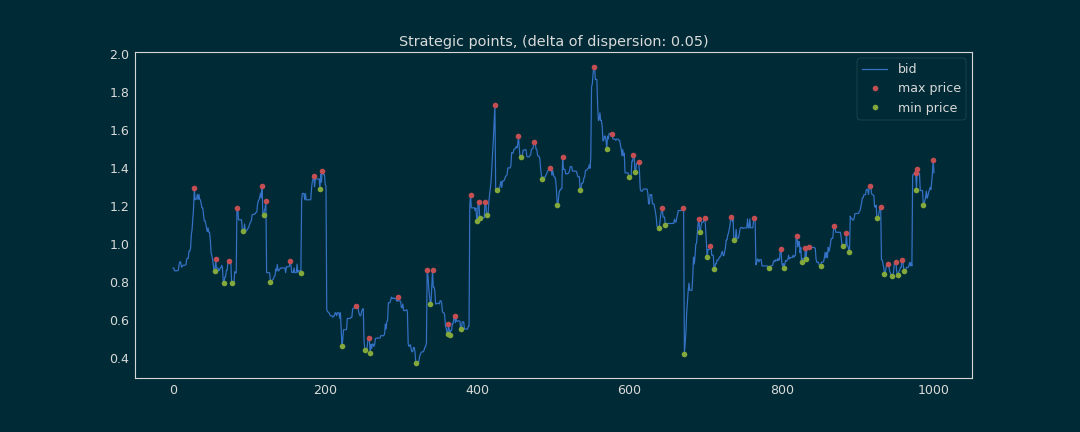
To make predictions, three actions are available :
- Buy (green point)
- Sell (red point)
- Wait (rest of tickers, blue line)
example:

We want to buy a cryptocurrency when we have a bottom point, because we know that after this minimum, the price will increase so it is a good time to buy. The tickers with this minimum value are labeled “buy”. Moreover we want to sell a cryptocurrency when we find the top point(the max price), these tickers are labeled « sell ». The rest of the tickers are labeled « wait », and for this last one we do nothing.
Data transform to LSTM format
For this step we only keep numerical values. We then pack the data by rows because LSTM is made to be optimal on time series.
Our packets are sorted in chronological order:

We keep the label of the last ticker to label the packet. For our last example:

A packet in our list is an actual snapshot of the market. Similarly to image recognition, we want to differentiate our image label.
At this stage, what could you expect about the prediction ?
A lot of “wait” predictions. Why ?
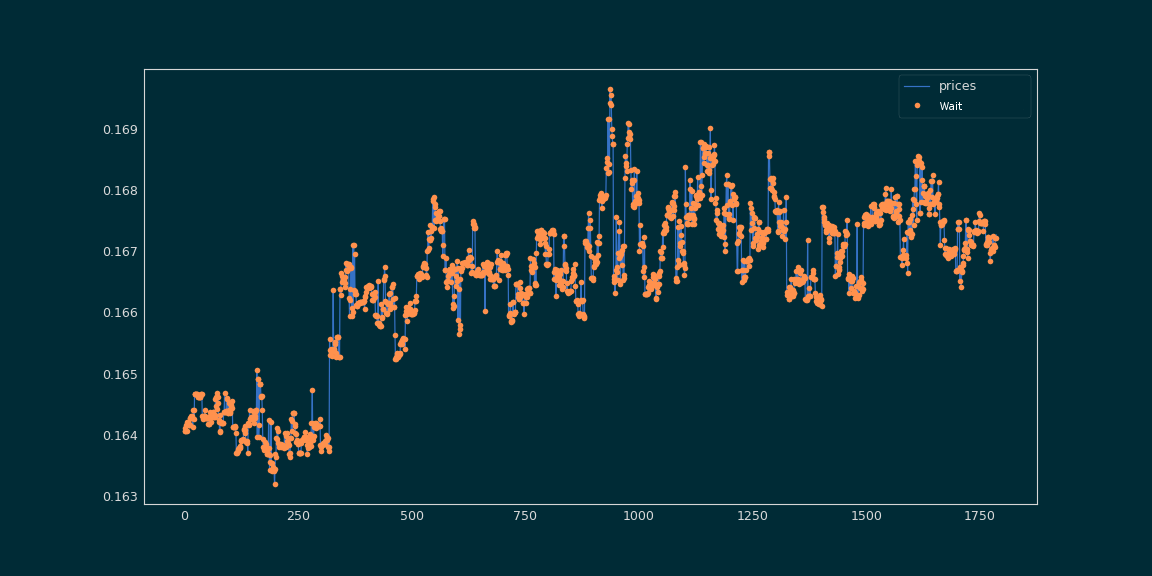
Because most of packets are labeled “wait”, much more than « buy » or « sell ». Since you have to sell or buy at the best time, most of the labels are labeled “wait”. In our context, our model’s purpose is to predict in all cases « wait ».
Imagine tomorrow you have three exams, in Cinema, Physics and History. You know nothing about this courses, you decide to study History three times more than Physics and Cinema. You will obtain better grade in History, because your brain remembers more things in this course. In Data Science, this problem is called unbalanced data. To guarantee an efficient learning, you should have the same number of tickers labeled « wait », « buy » and « sell ».
Having unbalanced data is a very common problem. Most machine learning classification algorithms are sensitive to unbalanced data. An unbalanced dataset will bias the prediction model towards the more common class(more informations).
In our example, we managed to balance the dataset with reducing the amount of wait-labeled packets.
Training
Now, we split our dataset in two subsets:
Training set (70 % of dataset): it is used to train our neural network, in other words it learns what to predict when it encounters specific values of the features. To do so, we selected the hyperparameter (neural network settings) of our LSTM such that the prediction accuracy is the best. To measure the performance of the chosen hyperparameter, we use the cross validation method.
**Testing set (30 % of dataset): **it is used to measure how well the LSTM performs at making predictions on that set.
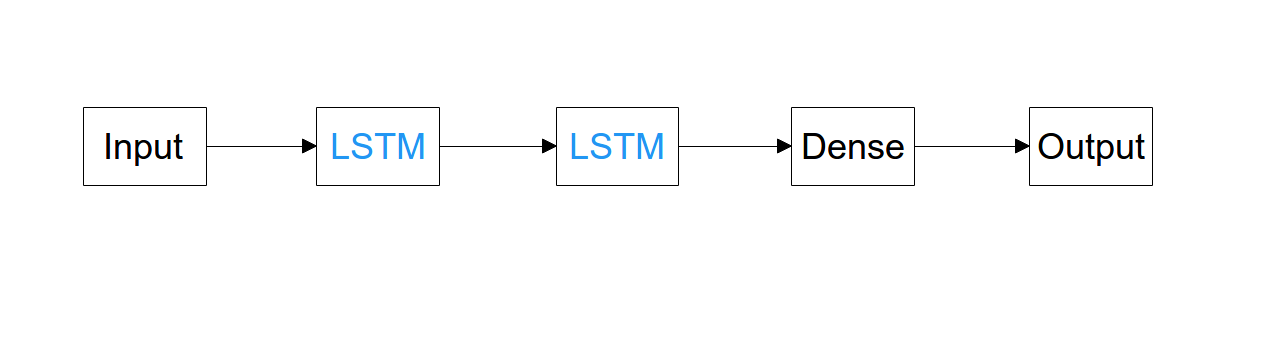
The financial values are non-linear, and considering the cross-validation we decided to add one LSTM layer, the new LSTM layer proposes more liberty to our neural network to implement its own logic, thus increased our accuracy. The middle LSTM layer is required to capture the relationship between features and label(input data and actions).
The number of hidden neuron is computed by combining the number of available features (input), the number of actions (label) we can do and the number of samples.
A hidden neuron is an artificial neuron, at the difference, it is into a hidden layer. In an artificial neural network is a link between input layers and output layers. (more documentation)
Accuracy:
The blue line is the training accuracy. The red one is also a percentage, the difference is that neural network has never trained on this data, it’s the cross validation data.
Loss:
Validation loss (green line) is the value of cost function for our cross validation data and loss (blue line) is the value of cost function for the training data.
Step 0, the accuracy of the training set and the cross-validation set are the same, 35 % precision. After many steps our neural network learns as well our context, and what action it has to predict. At the end of the training period the accuracy reaches 80%. The important thing to note is that the both curves has almost the same behavior according the number of steps.
This result means that we have selected a strong LSTM hyperparameter.
Predicting
At this time we just made good accuracy and cross validation but what about reality cases? To visualize the prediction, we used a loop on unlabeled part of data, then we repeated the data treatment we made like on the training process. The difference this time is the data size. To train our model a lot of packets are needed. But in real case only the last packet is needed to predict an action.
The most part of our neural network predictions make profits. This model made good accuracy and cross validation and in real case it seems to understand the cryptocurrency market.
Conclusion
Could a machine trained to trade cryptocurrency make profits ?
If everyone knew it, everybody would do it ! 😜
However, even if a professional trader would make more profit than us, it is amazing to see neural networks keeping capital in cryptocurrency markets. Furthermore, the model works only for the market used for its training, thus the program needs powerful infrastructures for being used in an integration process.
The results of our research continue to convince us that neural network technologies have proven efficient and still have lot of incredible uses to show us.
How could this be useful to others? In the future, we can imagine machine learning being applied to a lot of other issues, like supply prediction, we could use neural network to predict the best amount and moment to send supplies to stores. We could also use them for surge pricing, to predict the best prices for each sold or bought item.
But that is another story which should be written in another article.
Have you enjoyed it ? If so don’t hesitate to 👏 our article or subscribe to our Innovation watch newsletter ! You can follow Smile on Facebook, Twitter & Youtube.
Co-writer: Youcef Messaoud, Patrice Ferlet, Quentin Le Baron Thanks to the reviewers’ team ❤️. Sources: Github Smile innovation
Resources
-
Designing a neural network for forecasting financial and economic time series,(by Iebeling Kaastra and Milton Boyd b)
-
Deep learning unbalanced training data? solve it like this (by Shubrashankh Chatterjee)
-
What are Hyperparameters ? and How to tune the Hyperparameters in a Deep Neural Network? (by Pranoy Radhakrishnan)
-
How Fast is High-Frequency Trading? Faster Than You Think (Ivan Lo)
-
Learning from imbalanced data: open challenges and future directions (Bartosz Krawczyk)
-
LSTM original publication (by Sepp Hochreiter and Jürgen Schmidhuber)